Hi - I'm Dr Gareth Enticott, a research fellow at Cardiff University. My research focuses on the geography and sociology of animal health. I'm interested in how farmers, vets, policy makers and conservationists deal with and make sense of animal health on a day to day basis and what this means for the future of animal health and rural places in the UK. I am particularly interested in bovine tuberculosis.


Tuesday 8 November 2011

Misleading Data Visualisation: Defra’s TB Maps

UPDATE: Since I wrote this, Defra have been in touch to say that they have removed the maps from their website and are changing the data included on them, which is good. The challenge of how to present these data remains though.

Maps are powerful tools. They can be a great way of presenting (or visualising as people like to call it these days) data and statistics.  But as geographers know, maps are not always what they seem – and these maps (link no longer working) from Defra are a surprisingly good example of that.


It all looks nice and shows the advance of TB across the country – that part may be true. But actually, the maps are misleading. Here’s why:

The maps are supposed to represent the number of cases of TB. Only, the asterix tells us that it’s actually only about confirmed cases of TB – that’s cases where visible lesions have been found. In the new even more confusing jargon, these are “OTF withdrawn” cases. Or is it?

Below the picture you can see the number of reactors. Only, this is the total number of reactors – not the number of confirmed reactors (OTFW). Its a bit of a muddle – what is the map actually showing? If it’s about confirmed cases then why not give the actual number of confirmed TB reactors? That number would actually be a lot lower than the figures presented. I don’t have the figures of confirmed reactors (i.e. reactors with visible lesions) to hand, but for herd breakdowns figures show that around half are OTFW – although this varies by region: in Dyfed OTFW breakdowns account for 36% of all breakdowns, whilst in Gloucestershire its around 60% - quite an impressive difference considering both are supposed to be high incidence areas.

Personally, I think this whole debate about confirmed/unconfirmed reactors is not handled very well. Sometimes Government likes to treat unconfirmed reactors in the same way as confirmed cases (as is the case here), all go under TB restriction, and even when no visible lesions are found, Government likes to tell farmers that doesn’t mean they don’t have TB. At other times, they are treated separately – for example, the work on badger culling ignores unconfirmed cases, AHVLA only visit farms to conduct epidemiological investigation on confirmed cases, and the rules for going clear are different. If one of the purposes of the change to the OTF jargon was to help farmers understand the difference between confirmed and unconfirmed cases, then I think that misses the point about the reasons why farmers distrust science and the government.

Whatever the figures are, the shading on the maps is also confusing. I’m bound to point this out as a geographer –the maps are committing a gross ecological fallacy. Some of the later maps (2006, 2010) are essentially suggesting that every farm in the south west is under TB restrictions. We know this is not the case: even in the high incidence areas the number of breakdown farms is relatively low: Defra’s own stats show that for last year the % of herds with a confirmed (OTFW) breakdown is around 9% in Devon, 12% in Gloucestershire, and 4% in Dyfed. When you look at the numbers of farms under TB restrictions it’s higher, but not by too much: around 19% in Devon, 28% in Gloucestershire and 14% in Dyfed. So to suggest that all farms in these areas have TB as these maps do is misleading. But the maps also fail to distinguish between high/low incidence areas of TB. For example, looking closely you might think that an area like South Wales (low incidence) has the same kind of TB problem as West Wales, where the problem is much greater.


None of this is to say of course that TB in these areas isn’t a problem or needs to be reduced. It may also seem to be a bit of pedantry – those “in the know” understand the limitations of presenting the data in these ways. But this is the point: these maps aren’t meant for people in the know: they are an exercise in communicating science to people “not in the know”. And the main reason why you’d want to do that is to justify your actions to those people – to convince them that what you are doing is right.  So they are not simply objective representations: they have a purpose. Normally, in cases like these, I’d say something like this is a good example of why people end up not trusting the Government. However, there are similarities here with the use of statistics by other organisations involved in TB: the NFUs public attitude survey and the Badger Trust’s use of TB statistics being other examples. And when you take all three cases together you can see there’s a wider purpose to the use of TB statistics, found also in many other studies of policy making. Simply, it’s to repeat a well known fact in policy studies: statistics help to objectify claims, frame debate and advance the interests of different organisations.

Monday 7 November 2011

TB in Wales: what is really going on?

The other week the Badger Trust put out a press release about TB statistics in Wales - you can see it here (pdf). Ive been meaning to comment on it. Its not that its all wrong: its just that the picture is more complicated, and potentially more interesting than they let on. And the whole story doesnt completely support their argument either.

The Badger Trust's basic argument is that TB is declining massively in Wales, especially in Dyfed where a badger cull could take place. They say that this decline means that any badger cull should be off the agenda. This is right - see the graph below: the numbers of TB reactors in Wales have declined year on year since 2008. They are still quite a lot higher than they were in the year before foot and mouth disease which is responsible for the big spike after 2001. And they are also a lot higher than in the early 90s.


But the problem with statistics is that on their own these overall numbers don't really tell use the whole picture. Medical statistics use all sorts of methods to standardise mortality rates or disease incidence across populations taking into account age profiles in different regions. Even then you have to be careful about interpreting differences between different regions - they may just be occurring by chance.

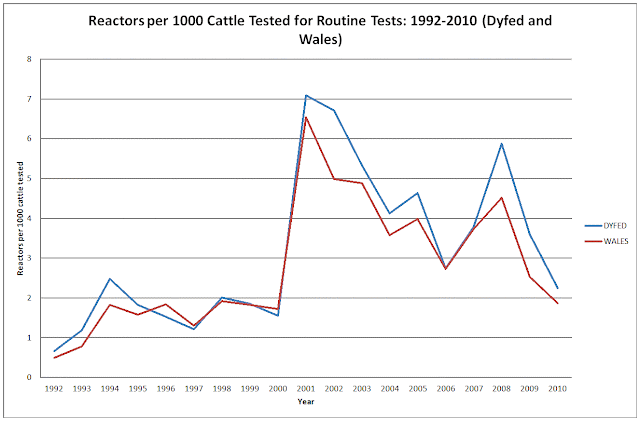
TB stats arent treated in the same way, but one thing we can do is to compare the overall amount of disease with the actual number of cattle tested. This relative figure is important as it tells us the actual incidence of disease and this is a better indicator of whether TB is going up or down. You can see this in this graph. There's little point comparing the number of reactors between different time periods if the number of cattle tested is quite different.


Reactors per 1000 cattle tested (RpT) is used as a standard indicator to show how TB levels have changed over time. You can see that for Dyfed and Wales in this graph. This graph is a bit like the other one. It shows that there has been a decline in RpT since 2008, but its still twice as high as pre-FMD, but more than half the extremely high rate of 2008. It also suggests - provisionally - that the decline may have ended. The 2011 figures are only for the first 6 months so should really be treated with a lot of caution, but if the trend continues for the next 6 months, then the decline may have ended.

Perhaps its no surprise not to see the Badger Trust commenting on this: their point is that the overall trend is still downward from 2009. Describing a new upward trend would spoil their story: although at least they do for England. Here though they are basing their data on 2010 figures. Its all getting a bit confusing: using a trend from 2009-2011 for one area and 2010-11 for another. Using stats to make a point? Maybe thats what statistics create...

There's an interesting story just looking at reactors from routine tests - that is tests where a reactor is found putting farms under TB restrictions, rather than tests designed to get disease out of an already infected heard (i.e. short interval tests). I dont have 2011 data for routine tests, so what the most recent trend is I dont know. But what is interesting is that these data suggest that, proportionately, the number of reactors is now getting back to similar levels to before FMD.


Just for good measure, here are the figures for new breakdowns from routine figures. Just to be clear, these are the % of tests of clear herds that result in either a reactor, or a reactor and/or IR. The first graph is for Dyfed, the second for England and Wales. Again the trend is similar: that its taken 10 years to more or less get back to where we were before foot and mouth disease. In fact for England, the trend is probably down from that before FMD.


So what do all these figures mean? On their own these statistics cant really be used to justify support for anything. They dont really suggest that additional cattle controls in Dyfed are having an effect: for a start the area whey they are being applied is just a very small part of the county, and then we'd need to look at other similar areas to see what was going on in them.  Actually this would be a really useful thing to do and to make those figures publicly available. There's potentially a whole load of other interesting stats too: the number of confirmed breakdowns; the number of repeat breakdowns; the survival times of herds between breakdowns etc etc. Wouldnt it be good to show all these data too? After all, arent we all supposed to be "armchair auditors" these days? Hmm. The criticism of armchair auditing is that sometimes statistics need to be handled with care, even when they are presented in relatively simple terms. In fact, changing the way Defra present TB statistics was one of the recommendations of the ISG.

Do these statistics support the Trust's claim that they undermine a badger cull? The basis of a badger cull has not really been made in terms of the level of disease. That's to say no-one has said above a certain level of disease then we need to start thinking about a badger cull, and below a certain level then its not required either. Remember, when the Krebs review was commissioned it was thought that there was a problem with TB and the government needed to look at a badger cull, but those figures were a lot lower than now. So even if the decline continues it wont change that, although it would affect the cost-benefit analysis for a badger cull.

Perhaps this disconnect between the need for badger culling and the level of TB is the most interesting thing about these statistics. Maybe what it highlights is the difference in expertise involved in disease control: the difference between a field approach which relies on local grounded experience to get the job done, and one which relies on more a scientific quantitative account of disease. In many ways thats what the debate in TB is about.


Note on data
You can recreate these graphs using data held on Defra's TB statistics website. To calculate Rpt its: no. reactors divided by number of cattle tested multiplied by 1000. For some reason in recent years they've stopped giving the actual number of cattle tested which means you cant calculate RpT. The data Ive used comes from an extract from Vetnet that Ive been doing research on. Ive not included any data from pre-movement tests. The 2011 figures are from the latest TB statistics release.


Friday 28 October 2011

Updated: the geography of OV procurement

I said in my earlier blogs on OV procurement that one of the problems is dividing up England into geographical "lots" to bid for. Too large and this means that the network of veterinary practices is likely to be too difficult to put together or sustain; too small and it means that practices will have to spread themselves over several different "lots" to sustain their current level of business. This could also be an organisational headache, particularly as AHVLA have suggested that each winning contractor will have to develop their own quality control and management systems.

So what does the current geography look like? To what extent are practices already working across the boundaries of the lots set by AHVLA? Thanks to AHVLA Ive been able to look at this with some new data they've sent me. Take a look at the following graphs. They show the districts that practices in Devon/Somerset/Cornwall currently test in (most of the practices are in Devon by the looks of things). The first is for the actual number of tests, the second is for the %. Ive limited the graphs to those conducting at least 400 tests per year.


Apologies for some of the chart junk: I realise it may be difficult to pick out some of the colours for the different. The point is though if these practices neatly followed the boundaries of the "lots" then they would all be one colour, but they're not. Although some practices have a lot of tests in just one of the districts (like no. 1069, 720 and 93) more have their testing load spread over 3 or more other districts. For practice 91, about 60% of testing comes from one district, the rest from several others.

What this means is that practices will have to be part of several different bids if they want to retain their current level of testing. Of course, if they don't, then that will mean changes to the structure of veterinary practices: some may get bigger and others smaller.

When you look closely at some of the small "lots", you can also see that there is already a lot of competition within them. Taking 3 random "lots", there are 5 practices with over 80% of their testing in 1 lot; 3 practices with over 90% of their testing in another lot; and 5 practices with over 69% of their testing in the last lot. Obviously the actual amount of testing will vary between these practices, but Ive already discounted the very small practices.

This boundary effect is most pronounced in the high incidence areas of TB, where the AHVLA have constructed lots that are relatively small. They've done this because they were seeking to make the lots of relatively equal size (financially). But in these areas, maybe it might be better if these areas weren't so small. Organisationally its likely to be easier to have larger areas, it would mean that one dominant practice couldn't control one area at the expense of others, and there'd be more incentive for practices to work together.

As usual: size matters.

Wednesday 26 October 2011

Does the gender of your vet influence your TB test result?

I thought I'd repost this given that the paper in question has been accepted for publication subject to some minor corrections.

According to the analysis, a vet's gender is related to the outcomes of TB tests. Its rather strange - I mean why would it? But curiously these kinds of results are no different to other findings elsewhere in human medicine: female doctors do things that male doctors dont. Im not into biological determinism, so Im uneasy with the idea that somehow there are inherent qualities that men or women have - I would have thought that there were wider contextual factors that were influencing the results of tests rather than gender itself.


The analysis is based on bTB test results between 2004-2009 in three different counties  of England and Wales - all high incidence areas. The results appear to show that even when controlling for herd size and test type, there are substantial differences between male and female vets in terms of the number of reactors they find.

Who finds the most reactors you say? Most people are surprised when I tell them - male vets. But finding the most doesnt necessarily mean they are better. The difference could be down to a range of factors such as biases in the way tests are distributed and/or differences in interpretating what is best for borderline cases. Either way, what the results show is that it is not a good idea to compare the performance of vets using these figures - and that issues affecting performance may instead lie in the way veterinary regulation is organised.

These results emerged partly by accident. I was looking at the data for other reasons and thought it would be interesting to examine. Gender is the only "social" variable in the VETNET database which is a shame. Due to anonymity reasons I can't include age, which would be interesting, or length of service (although I might be able to work out some proxies for this). I might be able to include some other factors such as the number of unique clients, or repeat visits in future analyses, but the way the data is organised in VETNET will make this a bit tricky.

The most disappointing thing is that originally I wanted to do a comparison of practices over time but this turned out to be impossible. This is because when you extract data from VETNET, the practice name for each vet is the current one. So, if a vet had moved between say 4 practices over 4 years, the data for that time period would not reveal that. Luckily, with the help of some local knowledge from a friendly vet, we spotted it - a practice that didnt exist 5 years ago was coming up in the results before it was established. I wonder how many people know that - I dont think the managers of the database knew until I pointed it out. And sadly that means its impossible to look at differences between practices, how they have changed over time, or the careers/migration patterns of vets using this database too. Maybe the new SAM system will sort all that out...


Thursday 20 October 2011

Interpretation: Warburton's Tackle and the TB Test

Being Welsh, I was disappointed to see Wales lose to France after Sam Warburton was sent off. Here's what happened:


What was perhaps of more interest was what happened afterwards: how pundits and rugby players argued that it was not a sending off. In essence the debate is about what a standard is and how they should be enforced. And that debate is similar to what Ive written about in relation to the standards of the TB test. Here's what I mean.

In the Guardian, Eddie Butler wrote of the Warburton sending off:
"there is always a choice. Something should have registered with the referee other than a black-and-white regulation. This was a foul, no question, but it was not a killer tackle. It was a yellow-card offence... If you lay down the law in unambiguous terms you are inviting ambition to be a more important factor on the field than a feel for the occasion. Rolland could not show compassion because it would jeopardise his chances of reffing another World Cup final. It was a pity, because his justice wrecked the occasion...The laws of rugby depend as much on interpretation as implementation. Refereeing a top game of international rugby is a fiendishly difficult job, but it is not made any easier by people trying to make it clearer. Rugby is what it is, obscure and open to flexible interpretation. Sam Warburton is a victim of rigid justice".

This kind of analysis was not limited to the Guardian. In the clip above, you will hear Lawrence Dallaglio and Francois Pienaar go on about the "occasion", how this was a "semi-final", how it was early in the game, and how no malice was intended. Mick Cleary in the Telegraph said similar:
"Any match, let alone a World Cup semi-final, is for the players and the fans, not for the hidebound detail of disciplinary protocol. The contest, as well as the spectacle, was grievously scarred by Rolland’s pedantry".
The point is that context matters, something that protocols and rigid standards cannot cope with - the broader interests of the game. Worse, they simply represent top-down power, denying the rights and skill of a referee to make up their own mind.

A similar point is made by medical and organisational sociologists. Firstly, that tighter you define rules, the easier is becomes for something to fail: what might be better is a set of looser rules. And secondly, that standards need to vary in order to work. This is the argument put forward by Stefan Timmermans and Marc Berg in the critique of protocols. In Marc Berg's book Rationalising Medical Decision Making its argued that protocols emerged out of a battle to make medicine more scientific, more rational but in doing so led to the erosion of other forms of expertise, not easily codified into formal language (there are some good studies, for example, of nurses' intuitive knowledge and its successful application in practical settings).

Timmermans and Berg take this further and argue that standards only work when they are allowed to vary locally - what they call local universality. The argument goes - like organisational sociologists - that unless standards have flexibility to meet local conditions and circumstances they simply wont work. Doctors, nurses, whoever are simply not going to follow certain routines if they dont fit with their environment. Better to allow them a degree of flexibility, to interpret what needs to be done. Flexibility wins out over rigid standards.

Something like this is what I argue is going on in TB Testing. There is a set standard to follow, but vets don't follow it always - that's common knowledge. The question is why this happens and does it matter? In the paper I suggest a number of reasons why it happens, from failure to enforce (i.e. the absence of coercive pressure legimises failure to follow the protocol), the training process and the creation of working cultures which may act as a coping mechanism to deal with high volumes of testing. In my posts on OV procurement, Ive also described how vets' emotional stakes in farmers' TB results may also lead to interpretations being cast on what counts as a reactor. But perhaps the main reason is that testing is dangerous. As one vet described to me recently, in order to comply with one EU directive, you have to break others. In this context, its unsurprising to see a bit of local universality going on.

The extent to which it matters also depends on context. Many vets will say that some variations in the protocol simply do not matter - the DNV report certainly finds that. Perhaps that is why government attempts to improve quality control has been so absent? Perhaps it also relates to the urban myth/reality that the protocol was simply made up quickly when the EU asked the UK for one by someone in Whitehall without speaking to practicing vets? But lets take something more definitive to do with the test: ear tags. Does it matter if you don't check them all? Maybe there's a reactor hidden in the shed or a cow with milk fever at the bottom of the field. It might be useful then. But what if we didn't have eartags, like in New Zealand? In a different system of regulation where trust is not based in the practices of audit, but in forms of self-regulation within the community affected by TB, then that step can be done away with. Its no longer integral to the test.

Standards, then. They aren't definitive: they are just products of the environments we live in.

Tuesday 18 October 2011

Vaccination: for better or worse?

Gloucestershire Wildlife Trust's (GWT) press release on their badger vaccination project has caused a bit of stir. You can read their report here (pdf) and the response of the British Veterinary Association here.

There are some interesting issues here when it comes to the communication of science. Over the last 20 years one of the oft repeated findings by sociologists is that the public have lost faith in scientists and science. In agriculture the easy example is the BSE crisis and the way that was handled by John Gummer and MAFF. Here he is trying to force feed his daughter a beefburger:


Of course, its not just the "public" that have grown sceptical of science. The outbreak of foot and mouth disease in 2001 is another agricultural example, but this time it was farmers that became distrusting of government scientists.

In studies of risk communication, sociologists have argued that the media plays an important role in amplifying risks to the public, encouraging their distrust of science and shaping behaviour which others might call irrational. In the contexts in which people live, these behaviours make perfect sense though. A classic example of this is what happened around the MMR vaccine, and perhaps many of the other classic tabloid stories about miracle cancer cures that Ben Goldacre's Bad Science column in the Guardian likes to document.

The problem with the Social Amplification of Risk Framework (SARF, as it is known) is that as a theory its quite difficult to prove. It makes perfect sense, but trying to definitively disentangle what makes people behave the way they do and separate out the relative strengths of different factors such as the media is rather difficult. But it seems obvious that poor reporting, over-stating certainty, or not basing conclusions on the data will just feed people's prejudices. So much so that recently some scientists proposed that they should be able to vet any media story for accuracy before it is  released - see here.

Unfortunately, in the case of the GWTs press release it seems that some of its conclusions don't correspond particularly well to the evidence they are actually presenting. The BBC reported that GWT were "delighted" with the results whilst the GWT claimed that their trial "provides proof that there is an affordable and viable alternative to the proposed [badger] cull". The report though is just about the financial aspects of how they deployed vaccination. The GWT claim that £54/ha for vaccination is "affordable": perhaps it would be more affordable if they had more farms involved and were able to generate some economy of scale. But affordability is also a bit like beauty: in the eye of the beholder. And without comparable costs, and an analysis of the benefits too, then the report is simply an exercise in accounting: but that's not necessarily a bad thing.

On seeing the report, the British Veterinary Association subsequently accused the GWT of over egging the pudding. They argued: “To conclude from this report that the badger vaccine is a viable alternative to culling in eradicating TB is unrealistic at best and spin at worst". To be fair to GWT, the report clearly points out that their project was not looking at the effectiveness of the badger vaccination: but that makes any positive or negative comparison with other forms of badger control a bit meangingless. In fact Defra's own Badger Vaccination Deployment Project never set out to test effectiveness even when it had 6 areas in it.

Stories like GWTs may be a bit like SARF, but rather than creating controversies they just deepen the divides between opposing sides. This polarisation helps convince people that there is a 'them' and an 'us'; there are heroes and villains, sides to take. These 'framing' battles may be central to political controversy, but they are unlikely to be the best way to organise debate about bovine TB. Perhaps, in the absence of evidence of the effectiveness of vaccination it might have been better not to have commented on that side of things. But as was pointed out to me, the evidence on the effectiveness of the government's proposed cull is not there either.


@GarethEnticott @alistairdriver nor is there on proposed cull methodology.Thu Oct 13 11:11:46 via TweetCaster for Android

There is of course some evidence on what BCG vaccination does to badgers' TB status in this paper (£). Perhaps the most interesting thing about that paper is how different tests for TB in badgers provided different results. The best result is a 74% reduction in positive tests for TB in badgers, but some of the other tests are as low 20% and the reduction not statistically significant. Which result is right? The variation isn't adequately explained in the paper. Is the best result always the right result?

Maybe its not too surprising to see pro-vaccinators citing the 74% figure. Maybe its right? Who knows? And that's partly the point: that when it comes to knowing disease, there's a lot of uncertainty around. This applies to cattle TB as much as badger TB. So, if we see those in charge play fast and loose with uncertainty, should we be surprised that others do too? And should we be surprised that amongst all this uncertainty, people reach for what they think or feels right?

Monday 17 October 2011

OV Procurement: My Analysis

The following is all my posts on OV procurement condensed into one...

Procuring Vets to Conduct TB Tests

Recently the Animal Health and Veterinary Laboratories Agency (AHVLA) announced a consultation on its proposals to require vets to compete with each other for TB tests. In other words: they are going to introduce a competitive tendering process into TB testing by dividing the country into geographical lots for which vets can bid for. Until now any qualified vet could test, so long as they had attended AHVLAs 1/2 day training course. You can see the details here.

Of course, the veterinary profession are concerned about these proposals - perhaps rightly. The editorial of their weekly journal - the Veterinary Record - highlighted some of them here, and the podcast produ­­ced by AHVLA alludes to them too. Surprisingly there's been less concern amongst the agricultural industry or press - maybe they have other things to worry about? But what are the likely impacts of this to farming and the veterinary profession? And are the AHVLA's desired outcomes likely to be delivered? Lets look at some of the evidence.

First, what does TB testing mean to the veterinary profession - after all, isnt it just a boring technical job that pretty much anyone could do? Wouldnt vets be better off using their brain to sort out more interesting problems?  This maybe true, but unfortunately vets are required by law to conduct TB tests and that's likely to continue for some time. What this has meant is that practices can draw a nice income stream from TB testing, particularly in areas where TB is endemic.

How much income? Lets look at some of the evidence from one county with a TB problem: in 2010 this county had nearly £3million pounds worth of TB testing shared out among just over 250 vets in nearly 70 practices. on average each practice received around £40k a year - enough to cover one vet perhaps . But its not quite as simple as that because a significant proportion of the tests were conducted by just 5 practices. In fact, of the near £3million spent, 43% went to just 5 practice who also found over half the reactors in the county. They also had about a quarter of the veterinary workforce. Each of these 5 practices were receiving £250k a year from TB testing, or about £20k for everyone of their TB testing vets (one actually got closer to £30k). 

Perhaps you can see the dilemma? In some areas like this one, veterinary practices are financially hooked on TB testing - its like a drug: take it away and there's going to be some serious comedown. But perhaps we shouldnt be too hard on the veterinary profession: it could be that this business is keeping large animal practice alive in rural areas. Here's why: vets have to provide out of hours cover, and the more vets you have, the easier that becomes to handle; who wants to be getting up every other night to go to a calving? The larger the practice, the greater distance between out of hours shifts. If you cant provide that, then you'll find it difficult to attract good staff. Its one of the reasons why practices close down, and other practices get larger. That of course, and the wider economic pressures in agriculture which mean that farm animal practice is not a great business prospect.

So, what does all this have to do with OV procurement? Well, imagine if one of these top 5 practices does not win a contract: there could be some serious damage to the provision of veterinary services in those areas. Alternatively, the procurement process could lead to further amalgamations of practices and smaller ones - the ones who lose out on a contract - closing down. For farmers too, what will this mean. Obviously it could mean that vet services are harder to come by, or are more expensive in those practices that arent subsidised by TB testing than those that are. Concentrating TB testing into a few rather than many practices may also perversely prevent competition. Whatever happens, things are unlikely to stay the same.

And perhaps that is the point: there is nothing inevitable about this process - as coincidentally I pointed out in the same issue of the Veterinary Record where AHVLA unveiled their plans (here (£), contact me for a free copy). Although the process is being driven by EU competition law, there is no requirement to run the process the way AHVLA are doing. Rather than divide up the country into lots, they could licence as many practices as they like, or they could make the farmer pay for their test (but reimburse it) from a list of 'approved' suppliers.

AHVLA may say they have thought of these issues - their podcast says they want a network of practices working together. But below I'll be describing why that may not be a good idea either. Finally, one last point: perhaps this whole process might reopen the debate over why vets conduct tests for TB anyway. Do vets really want to spend most of their time TB testing? Id say no. Perhaps the best thing about the OV procurement issue could be to reopen that debate. Given that TB policy is being framed as an economic issue, it would be remiss not to.

Lots and Networks 

So far then we've learned that vets in some areas rely on income from TB testing and that losing that business would have serious consequences for vets and farmers (if you missed part 1, its here). But what of the OV procurement proposals themselves - do the proposals make sense? Will they prevent these negative consequences? Lets find out. 

Lets start with the map from the AHVLAs consultation notes. It shows how England might be divided up into different "lots" containing a certain amount of TB work that vets can bid for. The areas are based on council boundaries and the colours show how they've been grouped together to form the lots. As a geographer, Im not sure this is the best way of doing it, but then again there are few other alternatives if you want lots to be based on specific areas. You could try to come up with areas based on the reach of existing practices - that would be interesting to see, and you would be able to see where you'd get most overlap and competition between existing practices.

Some of the lots are a lot bigger than the others - look at the size of the lot in Norfolk, Suffolk, Cambridgeshire, and Hertfordshire: its massive. Now look at Torridge in north-west Devon: its tiny in comparison. Of course, the variations in size reflect the differences in demand for testing: but these variations will also throw up different challenges of managing TB testing in each of the lots. Arguably, the level of disease in each lot is going to shape what kind of veterinary organisation wins the tender. Let me explain:


One of the problems with dividing up the lots according to area is the boundary problem: veterinary practices don't just serve district council areas, they cross them. In fact, disease and geography tend not to mix well at the best of times - its why vets like to say "disease knows no boundary" and why devolution of animal health policy has been something of a challenge (something Ive written about
here). The solution to this is to encourage veterinary practices to work together to form a network of practices who would collectively bid for the lot. This also has the advantage of not disturbing the practice structure in that particular area, so where you have several big practices in close proximity, they all have a chance of surviving rather than one taking all the work to the detriment of the others. This though is the obvious challenge: will practices be able to work together?